

Measuring modernization risk and business value
You measure modernization risk and business value on a funded programme by running two linked scorecards: a quantified risk-exposure score built from your existing risk register, and a staged value-realization scorecard with leading and lagging indicators, releasing each phase's budget only when both clear an agreed threshold — not by checking a readiness score once and never reading it again.
Book a solution review See the related solutionBy Netbase Consulting and Transformation Desk · Reviewed by David (CEO) · Updated · 11 min read

This guide is for CTOs, CFOs and transformation sponsors who already chose a route with our digital transformation and legacy modernization guide, scored the candidate system with the legacy system assessment checklist, and are now funding or running the programme. It picks up after those two decisions: the question has moved from "should we modernize, and how" to "is the risk still managed, and is the value still real, at this stage."
In this guide
- How is this different from the pillar's risk register and the checklist's scoring?
- Quantifying risk: turn the register into an exposure score
- The value-realization scorecard: leading and lagging indicators by stage
- What not to measure
- Running the two scorecards together
- Where AI fits in risk and value tracking
- What delivery record exists, and what does not
- Alternatives: who owns the two scorecards
- Limits of this guide
- Frequently asked questions
- Next step
How is this different from the pillar's risk register and the checklist's scoring?
The checklist scores one system's business value against its technical health once, to decide whether and how to modernize it. The pillar's risk register lists named risks with a likelihood signal, a mitigation and an owner, reviewed at every stage change. Neither turns those findings into a number a committee can compare across risks, and neither tracks business value once the programme is under way. This page runs after both: it scores the pillar's own risks for exposure, adds the value-tracking half the register does not cover, and ties a funding release to both.
Quantifying risk: turn the register into an exposure score
Score each risk group from the pillar's modernization risk register on two axes — likelihood (from the register's own signal) and business impact, stated in the same unit the value scorecard uses below (cost, continuity hours or revenue at risk) — then multiply for an exposure number comparable across groups. CISIN's CTO guide to de-risking legacy modernization makes the same case: a legacy system's risk is a business liability, not only a technical one, and should be quantified the same way a financial risk is — through total cost of ownership, the revenue a slow time-to-market loses, and the business-continuity exposure if "the one or two engineers who understand the system leave the company."
| Risk group (from the register) | Likelihood signal | Business impact if it lands | Score it high when |
|---|---|---|---|
| Continuity (hidden business rules, broken integrations) | Nobody can explain certain behaviours; undocumented exports and scheduled jobs | A core process stops, or produces silently wrong data | More than one signal is present and no characterization test covers the behaviour |
| Data (loss or corruption) | Poor data quality, many sources of truth | A reconciliation gap that reaches a customer invoice or a regulator | The last rehearsed migration had any unresolved reconciliation line |
| Delivery (scope creep, vendor or skills lock-in, AI output taken as fact) | "While we are at it" requests; only one person or supplier can change the system | The programme's cost or timeline moves without a funding-gate review | A change lands outside the written target process, or a single name owns all the knowledge |
| Adoption and revenue (adoption failure, revenue dip after launch) | Staff were not involved in design; URL, checkout or search changes are planned | Lost transactions, service calls or staff workarounds after cutover | Training and champions are not yet named for every affected team |
Re-score the table at every stage gate — the same cadence the pillar already recommends for the register — and whenever a new likelihood signal appears. The number is for comparing risk groups against each other on this programme, not for comparing across programmes or claiming a precise probability.
The value-realization scorecard: leading and lagging indicators by stage
Leading indicators predict whether value is coming; lagging indicators confirm it already arrived. Reading only lagging indicators — an annual savings figure, a revenue change — means a struggling programme is not caught until the number already missed its target. Track one of each per stage, and treat a weak leading indicator as an early warning the stage's lagging number will miss too.
-
Discovery and baseline
Baseline cost, cycle time and defect rate fully documented for the target process
- Lagging indicator (read at the gate)
- Written, business-owner-approved target state
- A weak leading indicator predicts
- A funding request with no number to compare against later
-
Migration and parallel run
Reconciliation match rate between old and new systems
- Lagging indicator (read at the gate)
- Defect and rework rate against the documented baseline
- A weak leading indicator predicts
- A cutover rehearsed on incomplete data
-
Cutover
Cases closed without a rollback or a manual workaround
- Lagging indicator (read at the gate)
- Service continuity against the agreed recovery objective
- A weak leading indicator predicts
- A revenue or service dip in the days after go-live
-
Post-launch stabilization
Support-ticket volume and workaround count trending to baseline or below
- Lagging indicator (read at the gate)
- Cost run-rate and cycle-time change versus the documented baseline
- A weak leading indicator predicts
- A "completed" migration that never reduces running cost
Release the next stage's budget only when both the stage's lagging indicator and its risk-exposure score (from the table above) clear the threshold agreed at the previous gate — a programme that completed its migrations on schedule but left its cost run-rate unchanged has produced outputs, not business value, and should not advance funding on schedule alone.
What not to measure
Some activity counts look like progress and say nothing about risk or value; tracking them invites a programme to report itself healthy while the two scorecards above tell a different story.
- Lines of code migrated, VMs provisioned, or modules completed. These count effort, not outcome; a programme can finish forty migrations and never reduce the support cost that justified them.
- Story points or sprint velocity. These measure a team's own estimate of its effort, not whether the process it touched got faster, cheaper or safer.
- "Go-live achieved" as a final metric. A successful deployment is not a successful programme; the post-launch row above, not the go-live date, confirms or denies business value.
- A single blended ROI number across several systems. It hides which system produced the result, the same reason the risk table above scores groups separately rather than as one number.
Running the two scorecards together
-
Start from the pillar's risk register and the checklist's scores
, rather than re-collecting evidence assessment already gathered.
-
Agree one business-impact unit before the first gate
cost, continuity hours or revenue at risk — so the risk score and the value scorecard compare on the same terms.
-
Document a baseline for every indicator
before migration work starts; a skipped baseline cannot prove a later number is an improvement.
-
Set each stage's funding-gate threshold in writing before the stage starts
, so it is not negotiated under pressure from a programme already behind.
-
Read leading indicators monthly, lagging indicators and the exposure score at each gate
, in one report, not separate IT and finance documents.
-
Stop or re-scope at a gate that does not clear
, rather than carrying a missed threshold forward on a promise.
-
Re-score risk whenever the register changes
, so the exposure table stays current between gates, not only at them.
Where AI fits in risk and value tracking
AI never decides a funding-gate outcome; it only shortens the time to notice that an indicator moved. Netbase works with the major commercial and open-source AI models, chosen per project.
-
Available capability
Automated exposure-score and indicator alerts
Flagging when a risk group's likelihood signal or a stage's leading indicator moves outside its agreed band, so the programme owner reviews it before the next funding gate, is a machine learning feature; not yet tied to a published Netbase modernization-programme case.
-
In delivered work
MLOps pipeline
Built for a client that is not named, an MLOps pipeline is the kind of monitoring infrastructure the growth capability above would run on, once a programme has one.
What delivery record exists, and what does not
- What exists. Netbase's six-step delivery lifecycle runs discovery and strategic alignment through agile execution with outcome-based milestones to ongoing support, the same stage structure this scorecard's gates sit on. The Netztech Magento 1 to Magento 2 migration is a published, scoped and dated record (35 working days, 11 extension modules migrated) of the kind of stage a leading indicator like reconciliation match rate would track. Netbase also offers fractional or interim CTO, CIO and Chief Digital or Transformation Officer engagements, structured as a monthly retainer over a 3 to 12 month term, and a fractional AI-transformation-advisor role with written, outcome-based milestones agreed before each one starts — a plausible owner for the scorecard above. Most Netbase projects are delivered on fixed-price contracts agreed after discovery; milestone-based, monthly-retainer and KPI-linked terms are also offered. The delivery risk group above draws on the same security practices applied across Netbase engagements, under Netbase's ISO 27001 certification and SOC 2 Type II attestation, which cover Netbase's own operations, not a client's system.
- What does not. No published Netbase record scores a programme's risk exposure or reports a leading/lagging indicator scorecard end to end; the Netztech record states its schedule and scope, not a risk score or a value figure. No risk-exposure number, ROI percentage or payback period is published anywhere on this page. The fractional CTO/CIO and AI-transformation-advisor offers are described as offers — no named client, board seat or mandate count is published for either.
Alternatives: who owns the two scorecards
| Owner | Strength | Risk | Choose it when |
|---|---|---|---|
| Internal PMO or transformation office | Owns the budget and the stage-gate calendar already | May soften a threshold under schedule pressure from its own leadership | The organization already runs disciplined stage-gate funding for other programmes |
| A fractional CTO, CIO or AI-transformation advisor | Independent of the delivery vendor; can read both scorecards without defending a prior decision | Needs onboarding time and full access to the register and the baseline data | No internal owner has the standing to stop a gate that does not clear |
| The delivery vendor running the modernization work | Closest to the leading indicators day to day | May be reluctant to report its own stage as a miss | Paired with an independent review of the gate decision itself, never alone |
| The steering committee, with no named scorecard owner | Lowest overhead to set up | Nobody owns re-scoring between meetings, so drift goes unnoticed until the next gate | Never, for a programme past its first stage; name an owner from the rows above instead |
Limits of this guide
- This is a Netbase method, not a published measured result; no risk-exposure score, ROI percentage or payback period is published here for any Netbase engagement.
- It does not replace the pillar's risk register or the checklist's go/no-go scoring; it starts once a programme built on those two is funded and at least one stage is under way.
- It assumes a risk register and a discovery baseline already exist; a programme without either should run the checklist first.
- It does not cover finance-team treatment of capitalized versus expensed modernization spend.
- A short reporting window after a stage change can show ramp-up noise, not a real miss; the monthly leading-indicator read separates the two before a gate decision is made.
Plan the next step with a Netbase consultant
Frequently asked questions
Only while the programme has not yet been funded. The register is a qualitative list of what could go wrong; once money is committed and staged, a steering committee needs the register's risks converted into a comparable exposure score and paired with a value-realization reading, which is what this page adds.
Read leading indicators monthly, and read the lagging indicators and the risk-exposure score together at every funding-gate review. Re-score a risk group immediately if a new likelihood signal appears in the register, rather than waiting for the next scheduled gate.
Neither alone. The programme owner named during assessment or discovery reads the leading indicators and the risk signals; finance reads the lagging indicators and the business-impact unit. A fractional CTO, CIO or AI-transformation advisor can hold both when no internal owner has the standing to stop a gate that does not clear.
Next step
Share the programme you are funding or already running, its current stage and its risk register, and we will book a solution review to set up the exposure score and the value-realization scorecard together. See the related enterprise operations solution, or browse more Netbase insights.
Work behind this guide
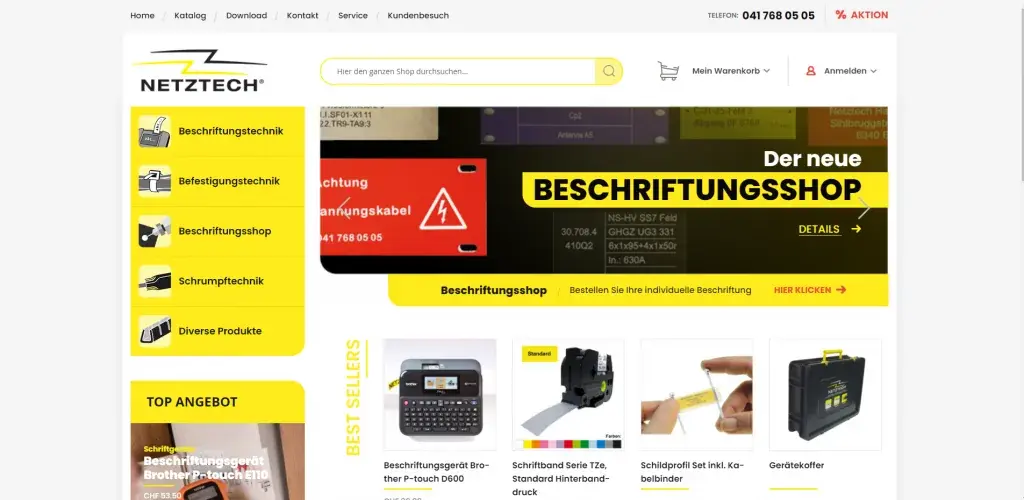
Netztech Handels AG, a Swiss supplier of labeling, fastening and shrink technology in Baar, needed its busy online store moved from Magento 1 Community Edition to Magento 2 Commerce.
Keep Reading
An organization that Netbase does not name, filed under professional services, needed a controlled way to train, evaluate, release and monitor its models.
Keep ReadingRelated services and solutions
 AI-enabled digital transformation consulting that ends in a delivery plan
Netbase provides digital transformation consulting for mid-market companies that need a prioritized roadmap with a delivery path, not a deck. We rank every change by value and risk, including where AI removes manual work, and the same team builds it. According to CEO Huy Nguyen (David), Netbase has served 500+ businesses across 80 countries since 2012.
Learn More
 AI-assisted legacy modernization that keeps your orders and data safe
Netbase provides legacy application modernization services for commerce and operations teams to move ageing platforms, such as Magento 1 stores, onto supported technology without losing orders, customers or data. AI speeds up code analysis and data mapping; every migration runs on a written, human-approved plan with rehearsal, staged cut-over and rollback, proven by Netztech's move to Magento 2.
Learn More
 Fractional CTO, CIO and digital transformation leadership
Netbase provides fractional technology leadership: a part-time or interim CTO, CIO or Chief Digital or Transformation Officer, or an independent technology advisor, working with your executive team or board for an agreed term. The leader owns technology and AI decisions with you, accompanies the business through them and hands over to a permanent hire. It is a growth capability.
Learn More
 AI-enabled enterprise operations solutions that run your back office
Enterprise operations solutions are the Netbase family of back-office software: a cloud ERP, CRM and workflow automation, and an integration hub that joins them to the tools a company already runs. They help operations, finance and sales leaders replace spreadsheets and disconnected apps with one workflow from first lead to closed books, with AI reading documents, forecasting and scoring leads.
Learn More
Work with Netbase remotely
Every Netbase engagement is delivered remotely, so clients in any country and any industry can work with us; Netbase has worked with clients in 80 countries. Contracts and invoices are issued by Netbase JSC, and payment is made by bank transfer to Netbase JSC's company account or PayPal Business. Talk to the CEO, Huy Nguyen (David), on WhatsApp or by email.
Discuss a project
Netbase JSC helps organizations design, build, modernize, and operate digital products and AI-enabled business systems.project@netbasejsc.com
+84 937 869 689
91 Nguyen Chi Thanh, Dong Da, Hanoi, Vietnam
Get in touch
Tell us what you want to build, modernize, or operate.